Trial-Based Economic Evaluations in R

A recent paper by Ben et al. (2023) provides an R tutorial for implementing economic evaluations–often cost effectiveness analyses–using data from clinical trials and analyzed using R. The article starts by providing a summaries of key issues researchers face when conducting these economic evaluations:
Missing values. Missing data are common in clinical trials either due to disenrollment, limited follow-up, or non-response. What are some methods to address this? The authors write: “Naïve methods, such as mean imputation of missing values and last observation carried forward, are discouraged because they do not account for the uncertainty in the imputed observations. More robust methods for handling missing and/or censored data are multiple imputation (MI), inverse probability weighting (IPW), likelihood-based models and Bayesian models. Of them, MI is most frequently used and is a valid method when missing data are related to observed data (e.g. missing at random, MAR) in economic evaluations.” The relevant R package for MI is mice. Skewed data. Cost data is often right-skewed with most observations around the median but a non-trivial amount of very high cost outliers. The authors cite a scoping review (El Alili et al. 2022) and state that appropriate methods to handle skewed cost data include: “non-parametric bootstrapping, generalized linear models (GLM), hurdle models and Bayesian models with a gamma distribution.”Correlated costs and effects. Sometimes, treatment effects may be correlated (positively or negatively) with costs. Approaches to handle correlated costs and effects, include “seemingly unrelated regressions (SUR), bootstrapping costs and effects in pairs, and Bayesian bivariate models.”Baseline imbalances in trial characteristics. Even when individuals are randomized in a trial, randomization may be imperfect and trial characteristics may be imbalanced. Some approaches to address these differences include: include regression-based adjustment, propensity score adjustment and matching.
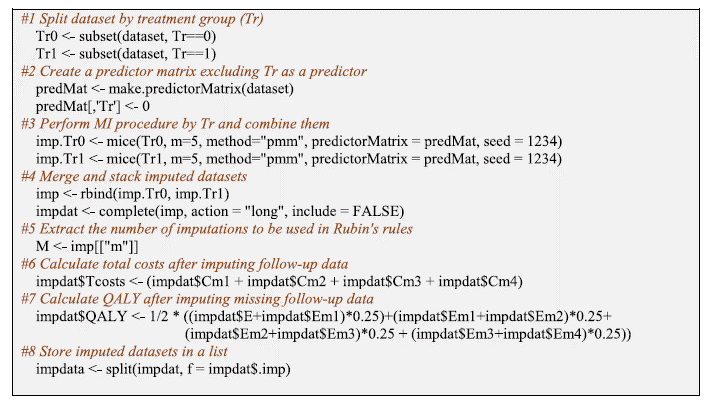
Here is some sample code for implementing each of the 4 approaches.
Missing values. The relevant R package for MI is mice.
Addressing skewed data and correlated costs with bootstrapping and seemingly unrelated regressions (SUR) methodology. The authors use the boot function provided by the boot R Package. The boot function is used to resample the data and for each bootstrap sample a SUR model is fit using the systemfit function. [The authors note that rather than using SUR, a linear mixed model (LMM) could be fit instead using the lme4 or nlme R packages].

Then one can extract relevant statistics of interest as follows:

Additional instructions are given on how to create a cost-effectiveness plane and cost-effectiveness acceptability curve. You can read the full article here.


