Local instrumental variables (LIV) vs. two-stage least squares (2SLS)

An interesting recent paper by Moler-Zapata, Grieve, Basu, and O’Neill (2023) compares local instrumental variables (LIV) with two-stage least squares (2SLS) to IV.
Local instrumental variable (LIV) approaches use continuous/multi-valued instrumental variables (IV) to generate consistent estimates of average treatment effects (ATEs) and Conditional Average Treatment Effects (CATEs). There is little evidence on how LIV approaches perform according to the strength of the IV or with different sample sizes. Our simulation study examined the performance of an LIV method, and a two-stage least squares (2SLS) approach across different sample sizes and IV strengths. We considered four ‘heterogeneity’ scenarios: homogeneity, overt heterogeneity (over measured covariates), essential heterogeneity (unmeasured), and overt and essential heterogeneity combined. In all scenarios, LIV reported estimates with low bias even with the smallest sample size, provided that the instrument was strong. Compared to 2SLS, LIV provided estimates for ATE and CATE with lower levels of bias and Root Mean Squared Error. With smaller sample sizes, both approaches required stronger IVs to ensure low bias. We considered both methods in evaluating emergency surgery (ES) for three acute gastrointestinal conditions. Whereas 2SLS found no differences in the effectiveness of ES according to subgroup, LIV reported that frailer patients had worse outcomes following ES. In settings with continuous IVs of moderate strength, LIV approaches are better suited than 2SLS to estimate policy-relevant treatment effect parameters.
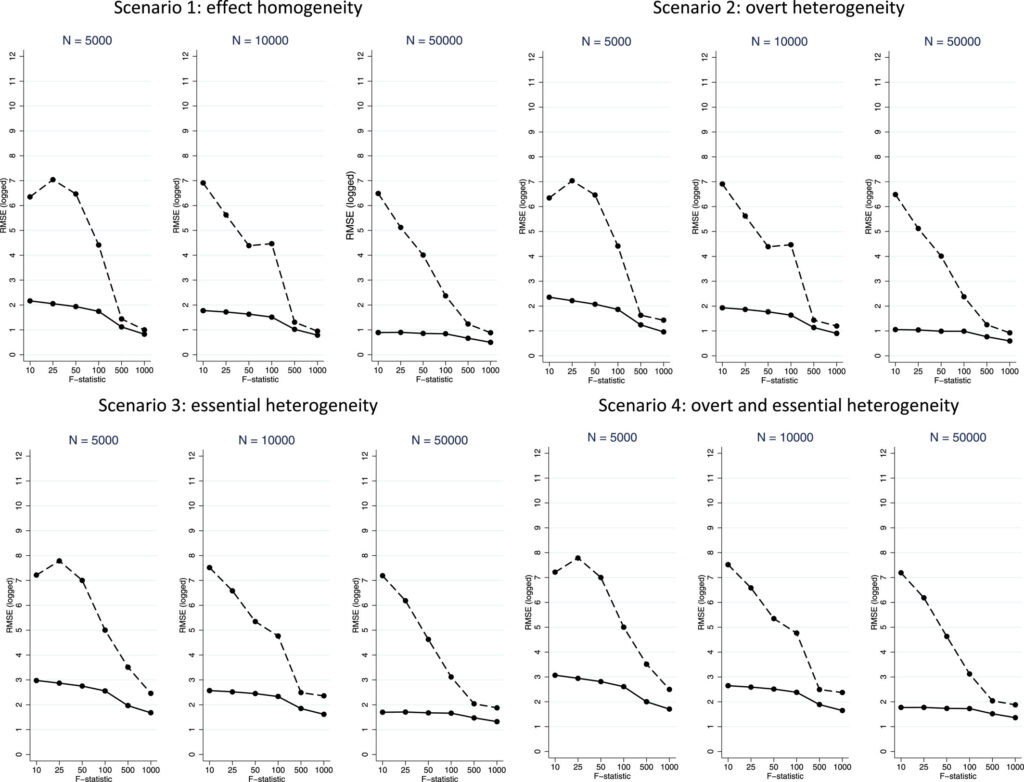
LIV seems superior but the key is not only having a strong instrument but the instrument must be multi-valued (i.e., non-binary) and have a sufficient support. The empirical application was for the ESORT (Emergency Surgery OR noT) study examining emergency surgery for three gastrointestinal conditions: acute appendicitis, gallstone disease and abdominal wall hernia. LIV has less bias, particularly at small sample sizes, than 2SLS and–as shown in the figure below using root mean squared error (RMSE), LIV also provides more precise estimates, particularly with smaller sample size. This is true even when there is heterogeneity.
Root Mean Squared Error (RMSE) plots for Average Treatment Effect (ATE) estimates from 2SLS (dashed line) and LIV (solid line) across the scenarios, with sample sizes (N) of 5000 (left), 10,000 (middle) and 50,000 (right).
You can read the full article here.


