Life Insurance Statistics, Facts & Data for 2022
With our insightful guide to life insurance statistics, facts and data, you can rest assured that you’re getting accurate information relevant to the life insurance industry.
At RiskQuoter, we provide you with accurate life insurance statistics and facts along with supporting information.
Life Insurance Facts and Statistics
The Life Insurance Marketing and Resource Association (LIMRA) provides research and marketing support to help life insurers understand their customers, markets, distribution channels, and competitors.
According to LIMRA, the percentage of consumers who reported owning life insurance (individual, group, etc.) was:
2021 – 52% of consumers owned life insurance2020 – 54% of consumers owned life insurance
This downward trend has been taking place for years, with the highest ownership percentage reported in 2011 when 63% of consumers reported owning life insurance.
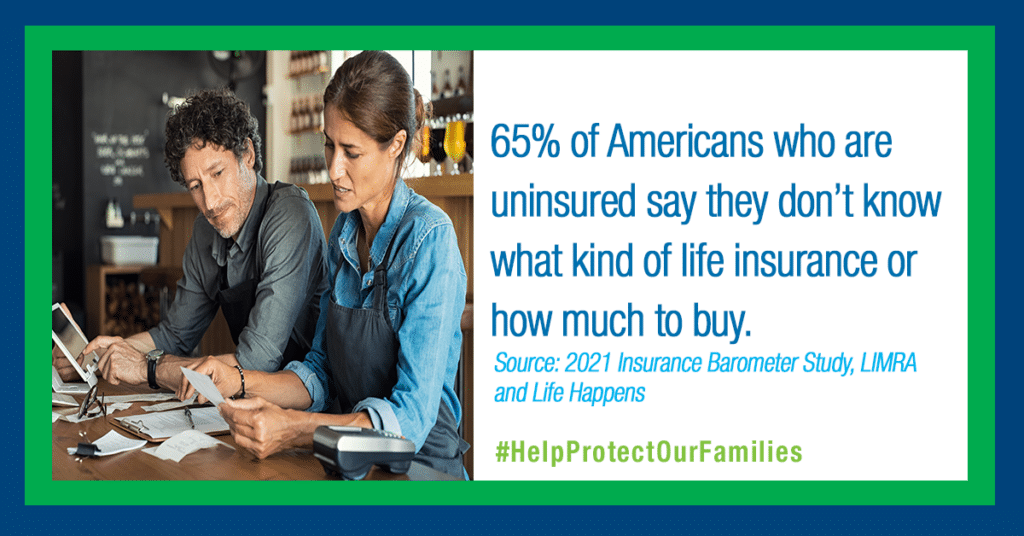
The LIMRA study further discusses the top 4 misconceptions consumers have:
1. Life insurance is too expensive – More than half of Americans overestimate the cost of life insurance, with 44% of Millenials overestimating the cost by as much as 6x!
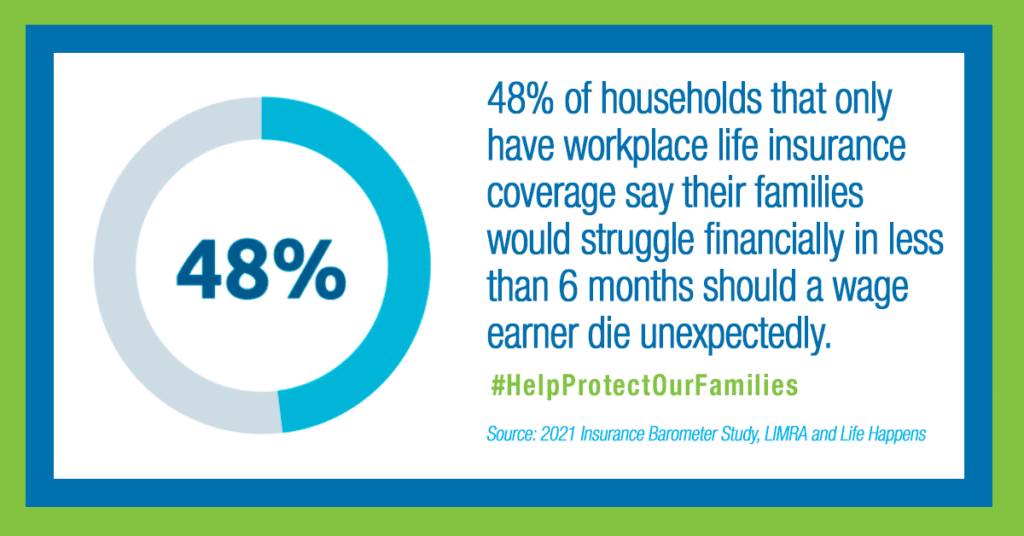
2. My workplace life insurance is enough – The median amount of life insurance offered by employers is either a flat $20,000 or one year’s salary. (for those in commission jobs, it’s usually your base salary)
3. It is too difficult to buy life insurance – COVID-19 has accelerated the adoption of e-applications and simplified underwriting.

4. I don’t need life insurance until I am older – life insurance is significantly less expensive for the young and healthy

We created our Life Insurance for Dummies (for smart people) guide to help people understand the entire process.
Who applies for life insurance in America?
According to the Medical Information Bureau 2021 MIB Life Index Annual Report, application activity by age group was as follows by age group:
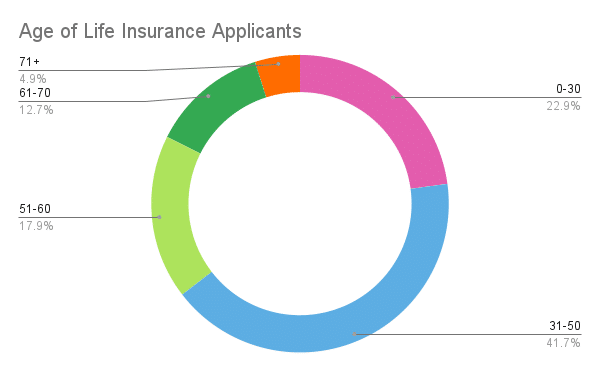
0-30 = 22.9% of applicants31-50 = 41.7%51-60 = 17.9% of applicants61-70 = 12.7%71+ = 4.9% of applicants
When an applicant applies for life insurance, the MIB is checked for prior application activity.
MIB member companies report information about applicants to the MIB, including high-risk medical conditions and other risks.
How much life insurance was bought in 2021?
The American Council of Life Insurers (ACLI) reported that Americans purchased $3.3 trillion of new life insurance coverage in 2020 which was an increase of 7.9% increase over 2019.
The average size of new life insurance policies purchased was:
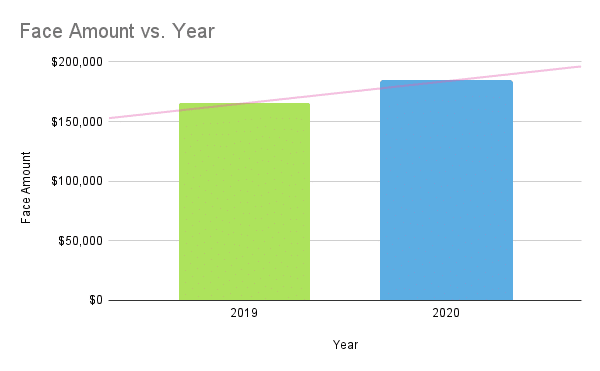
Average Face Amount by Year 2019 = $165,290 2020 = $183,780
The above chart is a good indicator that most people underestimate their life insurance needs.
What types of life insurance policies were bought?
In addition, the ACLI 2021 Life Insurance Fact Book indicated that:
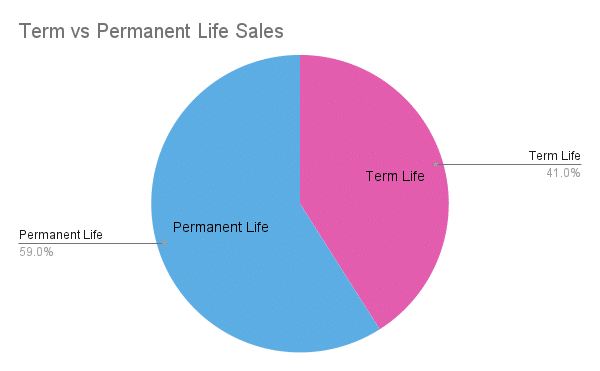
Permanent Life = 59% of sales, Term Life = 41% of sales
Milliman, an international actuarial and consulting firm for the insurance industry completes an annual survey related to term life insurance sales.
According to Milliman, the breakdown of term life insurance sales by term length is as follows:
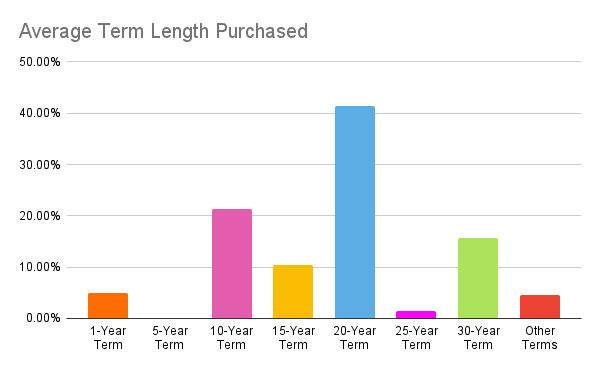
1-year term – 4.9% of sales5-year term – 0.1% of sales10-year term – 21.4% of sales15-year term – 10.5% of sales20-year term – 41.4% of sales25-year term – 1.5% of sales30-year term – 15.7% of salesOther terms – 4.5% of sales
Our own sales experience is very similar to the above percentages.
How is Life Insurance Distributed?
Life insurance is sold through a number of distribution models including:
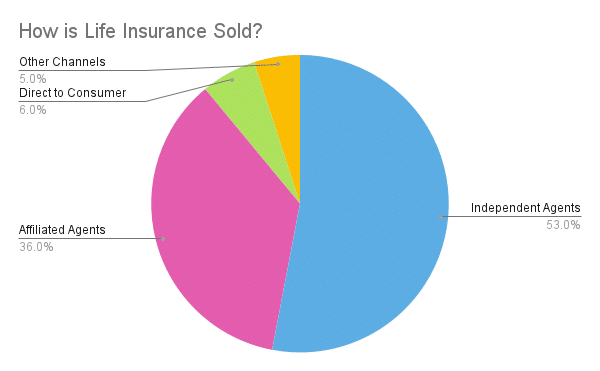
Independent agents – 53%Affiliated agents – 36%Direct to consumer – 6%Other miscellaneous channels – 5%
Source – U.S. Individual Life Insurance Sales Trends, Industry Estimates, 2019, LIMRA, 2020
Independent agents sell more life insurance than any other group.
Chances are that if you are an independent agent, your business is processed through a NAILBA member.
NAILBA is a trade association, representing 300+ independent insurance brokerages, 10,000+ brokers, and processes $4 billion in life insurance premiums annually.
Affiliated agents are also known as career agents – They represent a company such as Northwestern Mutual or State Farm.
Direct to consumer companies handle a small portion of the life insurance business, and the rest is typically sold through fraternal organizations.
Life Insurance Market Share
The National Association of Insurance Commissioners publishes its annual market share reports detailing the top 125 life insurance companies in terms of direct written premium.
The top 30 life insurance companies in the industry account for more than 75% of the direct written premium.
The latest reports available are based on 2020. The report covering 2021 is typically released in March.
CompanyPremiumMarket ShareNew York Life$11,598,908,4616.77%Northwestern Mutual$11,265,168,5916.58%Prudential$10,000,944,9285.84%Metropolitan$9,662,130,0675.64%Lincoln National$8,309,891,0474.85%Mass Mutual$7,896,230,2724.61%State Farm$4,968,203,0062.90%AEGON$4,792,523,9092.80%John Hancock$4,700,249,9602.74%Minnesota Mutual$4,683,600,8852.73%Guardian$4,254,831,4162.48%Pacific Life$3,975,419,0302.32%AIG$3,548,776,8642.07%Nationwide$3,194,905,4091.87%Equitable$2,854,593,2341.67%Sammons Enterprises$2,670,570,7161.56%Mutual of Omaha$2,660,649,4821.55%Primerica$2,578,185,9361.51%Globe Life$2,516,043,6481.47%Dai-Ichi Life Holdings$2,471,750,4491.44%Unum Group$2,384,152,5311.39%Voya Financial$2,352,166,6111.37%Principal$2,291,713,8521.34%Brighthouse$2,276,932,6761.33%Penn Mutual$2,212,856,9121.29%Hartford$2,001,474,2361.17%National Life Group$1,897,801,3921.11%Zurich$1,718,771,1971.00%Western Southern$1,653,145,6490.97%Thrivent$1,532,638,2030.89%Banner Life$1,397,080,9940.82%
Resources
This article was compiled from a number of industry resources as well as our own experience over the past 23 years.
Industry Resources Include:
LIMRA – 2021 Insurance Barometer Survey In January 2021, LIMRA and Life Happens engaged an online panel to survey adult consumers who are financial decision-makers in their households. The survey generated over 3,000 responses. The results were weighted to represent the U.S. population.
2020 U.S. Bureau of Labor Statistics – The Bureau of Labor Statistics measures labor market activity, working conditions, price changes, and productivity in the U.S. economy to support public and private decision-making.
Medical Information Bureau 2021 MIB Life Annual Index Report – this report provides insight into individual life insurance application activity.
American Council of Life Insurers (ACLI) 2021 Life Insurers Fact Book – This annual statistical report of the American Council of Life Insurers (ACLI), provides information on trends and statistics about the life insurance industry. ACLI represents approximately 280 member companies, which represents 93 percent of life insurance premiums in the U.S.
Milliman’s Term Life Insurance Issues 2021 Survey – Milliman is an independent risk management company that provides data-driven expertise to the life insurance industry.
Conclusion
We hope you learned a lot from this blog post. If so, we encourage you to share it with your friends and family.
Now that you know more about life insurance statistics and facts, get a quote today!
Related Articles