Is it time to start using a 2% discount rate?

Cohen (2024) argues that health economists should start using 2% discount rates for health economic models. Why is that? I summarize the article below.
First, Cohen discusses two different methods for estimating discount rates.
Ramsey equation. This approach consider 4 factors: pure time preference, catastrophic risk, wealth effect, and macroeconomic risk. The first 3 factors increase the discount rate as they indicate future impacts are less important; the last factor decreases the discount rate since it suggest greater future need. A fifth factor—project-specific risk—increases the discount rate but does not appear in the formal Ramsey Equation. In the literature, the value of pure time preference ranges from 0% to 1%; Claxton et al. 2019 recommends catastrophic risk of 0.1%; a wealth effect of 1% to 4%, and macroeconomic risk of -0.07% to -0.20%. Because, by definition, project specific risk varies by project, it is not used in standard Ramsey modelling. In the equation below,
δ = the pure rate of time preference; γ is the elasticity of marginal utility of consumption, and gc = the growth rate of per capita consumption, and σ is the uncertainty of economic growth.
Financial Markets. Market interest rates represent the return society could “earn” from alternative investments; thus a health investment with a return below the market interest rate imposes an “opportunity cost” exceeding its benefits. However, there are many different discount rates across different financial instruments which depend on factors such as bond payment tax treatment, return time frame, and credit default risk, among others.
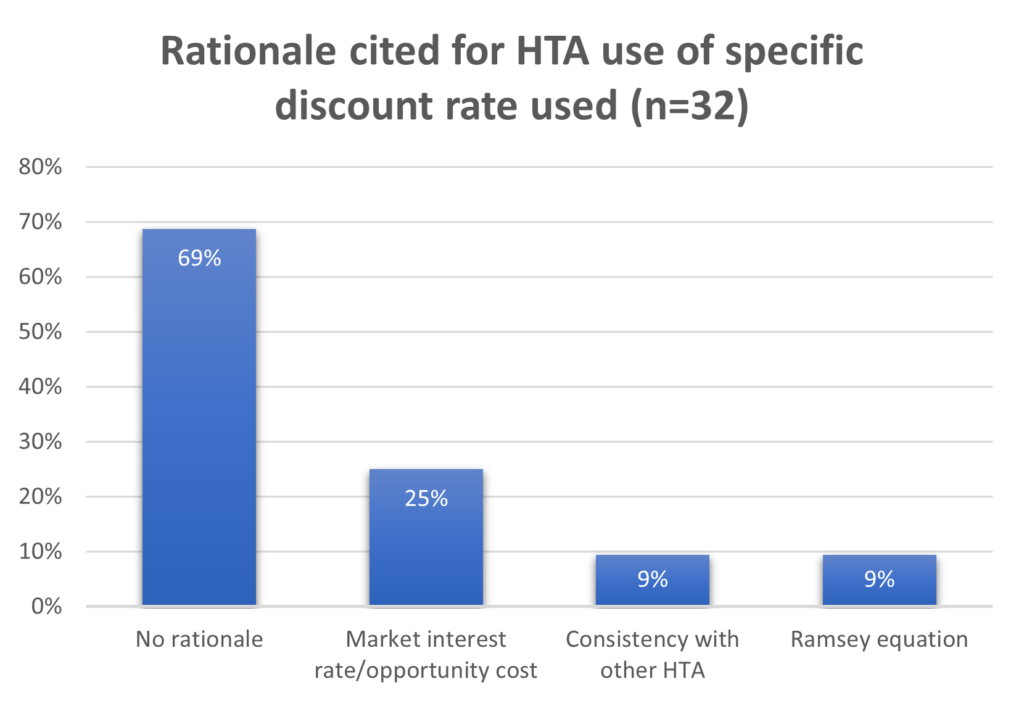
So which rationale do HTA bodies use to justify the discount rate they use in practice? Most do not give an explicit justification.

What rationale does Cohen give for lower interest rates? For the Ramsey equation, he notes that real growth rates in Western nations have fallen over time.
For 1995 to 2022…annual per capita consumption growth was 1.6% in the United States and
1.2% in the 17-country Euro Zone. Projected per capita consumption growth rates for 2030 to 2060 are 0.5% and 1.0% in these 2 areas, respectively. Averaging across these 2 areas (which are roughly comparable in size and economic output) yields per capita annual consumption growth of 1.4% for 2010 and 0.75% for 2030 to 2060, thus suggesting that in high-income countries, per capita consumption growth will be 0.65% per year lower in coming years than it was when many of these countries introduced their 3% discount rate recommendation. For elasticity of marginal utility of consumption values of 1 ≤ Ɣ ≤ 2,8 a 0.65% decline in per capita consumption growth (gc) indicates the wealth effect’s contribution to the discount rate has declined by 0.65% to 1.3%, suggesting a discount rate of 1.7% to 2.35% is now appropriate.
For financial markets, he notes that real interest rates have also declined over time.
A gross domestic- product-weighted average of real interest rates in 9 high-income countries for which data are available has tended to decline from around 4% before 2000 to around 1.5% in recent years.
Dr. Cohen recommends using a 1.5%-2% discount rate for value assessment if not as a baseline analysis at a minimum as part of a sensitivity analysis. Do you agree?


