Improvement Between Carmakers in the NHTSA 35-MPH Front Crash Test, 1979-1993

This is posted for historic purposes and says nothing about the current safety of these car companies.
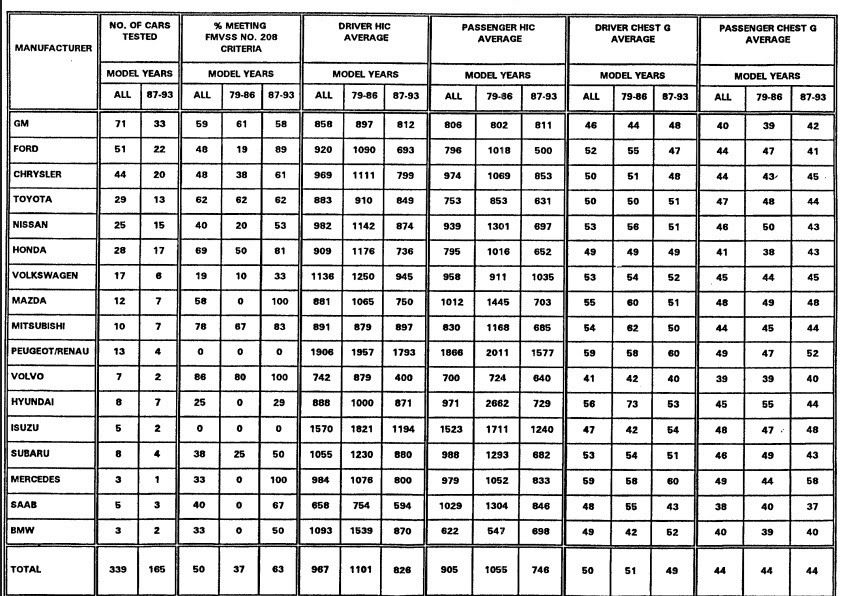
In 1993, NHTSA released a study showing the changes in crashworthiness between 1979-1986 vs. 1987-1993 models of passenger cars (not SUVs, vans or pickups) from various manufacturers. Not surprisingly, the 1987-1993 models were found to be safer on average. Also unsurprisingly, in both groups (1979-1986 and 1987-1993), Volvo had the best average performance and Peugeot/Renault the worst. The % Meeting FMVSS 208 Criteria is the percentage of vehicles tested in the given time period that had a HIC at or below 1,000 and 60 or fewer chest G’s for both occupants. General Motors, as an example, had 61% of its passenger cars tested as 1979-1986 models meet these criteria, and 58% of its passenger cars tested as 1987-1993 models.
17 of the 18 manufacturers made some degree of improvement; GM actually slightly worsened over the time period. Some, like Ford and Honda, made massive improvements while others, like Toyota and Peugeot/Renault, made minimal improvements.
Some averages must be taken with a grain of salt: BMW and Hyundai’s 1979-1986 averages are based on one crash test, as are Mercedes’ 1987-1993 averages.
Note the severe injury risk is taken from the average: for instance, a HIC of 1,101 with 51 chest G’s equals a 32% risk of severe injury.
For the 1979-1986 group:
average driver HIC was 1,101 with 51 chest G’s (32% risk of severe injury)
average passenger HIC was 1,055 with 44 chest G’s (28% risk of severe injury)
For the 1987-1993 group:
average driver HIC was 826 with 49 chest G’s (20% risk of severe injury)
average passenger HIC was 746 with 44 chest G’s (16% risk of severe injury)
Here’s a look at some of the individual companies (those with at least 10 tests)
GM
Tests: 38 / 33 (’79-86 / ’87-93)
Avg. injury risk 1979-1986: Driver 19% / Passenger 14%
Avg. injury risk 1987-1993: Driver 18% / Passenger 15%
General Motors had the largest group of tests of all the companies. In the 1979-1986 group, they were one of the best performers, second only to Volvo in average injury risk, and their 61% of vehicles that passed the FMVSS 208 standards was well above average as well. On multiple occasions, GM vehicles set new records for “best vehicle ever tested” up to that point, with the 1980 Cadillac Seville and 1982 Chevy Celebrity among these safety trailblazers. Nevertheless, after their early performance, GM stagnated, and in some cases, their vehicles backslid on safety – for example, their 5-star rated Celebrity was replaced with the 2-star rated Lumina. As a result, by the 1987-1993 period, they stood at about average.
Ford
Tests: 29 / 22 (’79-86 / ’87-93)
Avg. injury risk 1979-1986: Driver 35% / Passenger 26%
Avg. injury risk 1987-1993: Driver 15% / Passenger 9%
Ford started off as the worst of the American companies in this test, passing less than one-fifth of their 1979-1986 tests, though their average injury risk was near the average for the time. However, Fords saw a dramatic improvement as the company began to emphasize safety toward the end of the 1980s. Previously poor-performing models such as the Tempo were redesigned for improved crash safety, and some vehicles, like the ’87 Mustang and Escort, were downright impressive for the time. The average 1987-1993 Ford earned a strong 4-star performance for the drivers and even crossed the 5-star line for the passengers.
Chrysler
Tests: 24 / 20 (’79-86 / ’87-93)
Avg. injury risk 1979-1986: Driver 33% / Passenger 27%
Avg. injury risk 1987-1993: Driver 18% / Passenger 18%
Chrysler was a middle ground between the stagnation at GM and the massive improvement at Ford; their average results were almost smack-dab at average in both the 1979-1986 and 1987-1993 period. Percentage that passed FMVSS 208 at 35 mph? 38 and 61, compared to the fleet average of 37 and 63. Average injury risk? For driver and passenger, 1979-1986 and 1987-1993, 30% and 18% – right at average.
Toyota
Tests: 16 / 13 (’79-86 / ’87-93)
Avg. injury risk 1979-1986: Driver 22% / Passenger 19%
Avg. injury risk 1987-1993: Driver 21% / Passenger 14%
Toyota’s improvement was only slight; much like GM, it was well above average in the 1979-1986 period and near average in ’87-93. Still, the choice of time periods belies the improvements Toyota made earlier in the 1980s – every 1984-1986 Toyota passenger car passed the 208 standards, and two that failed in 1987-1993, namely the 1988 Tercel and 1992 Paseo, failed because their driver HICs were 1,005 and 1,006 respectively, and with chest G’s both well below the threshold, they actually had lower injury risks than many vehicles with higher chest G’s but HICs that slipped below the 1,000 threshold.
Nissan
Tests: 10 / 15 (’79-86 / ’87-93)
Avg. injury risk 1979-1986: Driver 39% / Passenger 45%
Avg. injury risk 1987-1993: Driver 21% / Passenger 13%
Nissan’s improvement over this period was gradual; their early ’90s cars were a little safer than their late ’80s cars, which were a little safer than their mid ’80s cars, which were a little safer than their early ’80s cars. All this incremental improvement added up, though, and Nissan made impressive strides on safety over this 14-year period.
Honda
Tests: 11 / 17 (’79-86 / ’87-93)
Avg. injury risk 1979-1986: Driver 36% / Passenger 22%
Avg. injury risk 1987-1993: Driver 17% / Passenger 13%
Honda’s 1979-1986 averages belie a sudden improvement during the period. Every Honda tested between 1979 and January 1981 failed the test – often miserably. Then, every Honda tested thereafter through the period passed. The 1987-1993 period continued this strong performance, averaging in the 4-star range for both occupants, though there were three vehicles – the 1990 Prelude, 1991 Civic and 1992 Acura Vigor – which fell into the failing range, though even these three outliers’ injury measures didn’t come close to the fatal levels seen on the 1979-1980 Hondas.
Volkswagen
Tests: 11 / 6 (’79-86 / ’87-93)
Avg. injury risk 1979-1986: Driver 45% / Passenger 20%
Avg. injury risk 1987-1993: Driver 25% / Passenger 26%
Volkswagen was somewhat below average for both periods, though like most carmakers they showed admirable improvement between the two time periods.
Mazda
Tests: 5 / 7 (’79-86 / ’87-93)
Avg. injury risk 1979-1986: Driver 38% / Passenger 58%
Avg. injury risk 1987-1993: Driver 19% / Passenger 16%
Mazda’s performance in the 30 mph tests of the late 1970s and the initial round of 35-mph tests from 1979-1981 is infamously bad; for instance, death would be a near-certainty for the driver of the 1981 incarnation of their small car, the GLC, in a 35-mph front crash. Luckily, in the mid-late 1980s, Mazda started paying some serious attention to safety, and it paid dividends; while every 1979-1986 Mazda flunked the test (albeit coming closer to passing with their mid-1980s offerings), every 1987-1993 Mazda passed.
Mitsubishi
Tests: 3 / 7 (’79-86 / ’87-93)
Avg. injury risk 1979-1986: Driver 32% / Passenger 34%
Avg. injury risk 1987-1993: Driver 22% / Passenger 14%
Not much to say here, just typical improvement.
Peugeot/Renault
Tests: 9 / 4 (’79-86 / ’87-93)
Avg. injury risk 1979-1986: Driver 89% / Passenger 90%
Avg. injury risk 1987-1993: Driver 83% / Passenger 67%
The 1987-1993 average performance for these two car makers was worse for the driver than any other car maker in the 1979-1986 period! In 13 crash tests, these two could never come up with even one passing vehicle. The average injury risks – 83% for driver and 67% for passenger – were double that of the second-worst carmaker, Isuzu, which had a 41% risk for driver and 40% for passenger. And while Isuzu had made considerable improvement – down from 82% and 75% in 1979-1986 – Peugeot and Renault’s 1979-1986 risks of 89% and 90% weren’t much worse than their 1987-1993 risks.


