Growth and Value Investing

Understanding the differences and similarities
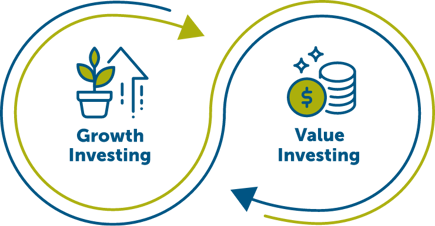
Markets move in different directions at different times, generally called cycles. Different market cycles tend to favour one investment style over another. Understanding how growth and value investment styles differ and where they can work together will help demonstrate how they can both play an integral role in your equity portfolio construction.
Let’s start with a simple definition:

What is Growth Investing?
The Growth investment style focuses on stocks (companies) with higher-than-average earnings and sales growth potential.
Growth stocks usually provide investors with returns as the underlying company begins to deliver on its expected growth potential and the market begins to notice.
Some growth stocks, particularly those still in their early stages, reinvest all their earnings to fund future growth. Therefore, growth stocks do not generally pay high dividends. Instead, their returns are driven by stock price appreciation.
What is Value Investing?
The Value investment style focuses on stocks (companies) whose share prices understate the analyst’s perceived value of the company, otherwise known as the company’s “intrinsic value.”
Value is typically determined by conducting a deep analysis of a company’s financial statements to better understand the value of the company’s assets and expected future cash flows.
Value stocks are often associated with well-established companies with stable fundamentals, but for various reasons, their prices have not kept pace with the overall market or their respective sector. These stocks are typically purchased and held under the critical assumption that they will appreciate once the market discovers and corrects this pricing discrepancy.
Be aware of the “Growth Trap”
 Although growth investing offers investors upside potential, when future revenue and earnings turn out to be weaker than anticipated, share prices have the potential to fall, leading to a growth trap.
Be aware of the “Value Trap”
 Although value investing offers investors upside potential, investors may still fall into a value trap only to find out that the stock’s price was low for a valid reason, and the investment ends up performing poorly or even losing value.
Understanding investment fundamentals:
How they apply to growth vs. value stocks
When selecting stocks for their portfolios, investment managers perform fundamental analysis. Part of this involves deriving characteristics from the companies’ financial statements and comparing them to industry competitors, a sector average or historical data.
Here are some common fundamental metrics and how they differ between growth and value stocks:

Price/Earnings (P/E) Ratio:
This metric is used to determine how much investors pay for every $1 in company earnings. For example, a P/E ratio of 15 indicates that investors pay $15 for every $1 of earnings the company generates in one fiscal year.
Comparing the P/E ratio against similar companies will help investors understand if the price of a stock is appropriate, undervalued or overvalued. A lower P/E ratio relative to other similar companies is usually more desirable.

Growth stocks typically have a higher P/E ratio because investors are willing to pay more for the company’s growth potential or because the company is relatively new and is not yet generating strong, consistent earnings.

Attractive Value stocks will typically have a lower P/E ratio than similar companies, indicating that the stock price is currently undervalued relative to the earnings the company can generate.

Earnings Growth:
As a company’s future earnings growth cannot be known in the present time with absolute certainty, earnings growth is a forecasted value using an estimated growth rate.

Because growth stocks tend to be newer companies or those operating in new or growing industries, they will usually be characterized by higher earnings growth rates, as a large share of their earnings are expected to occur in the future.

Value stocks are often companies with more stable and consistent earnings. Since their earnings are more evenly distributed, value stocks usually have a lower earnings growth rate than growth stocks.

Dividend Yield (D/P):
A stock’s dividend yield shows how much a company pays out in dividends relative to its stock price.

Growth stocks will typically have a lower dividend yield since earnings are commonly retained to fund future growth in the company.

Value stocks typically pay more attractive dividends and often have a higher dividend yield since funding future growth is not commonly a key consideration.
What you can expect from value and growth
In normal market conditions, growth stocks tend to outperform in environments characterized by low inflation and low-interest rates, while value stocks tend to perform favourably under the opposite market condition.
Possible reasons for this difference in performance:

Low inflation, low interest rates (Favour Growth)
Cost to borrow is cheaper, fueling opportunities for companies to expand and conduct more research and development.
Low inflation puts greater pricing power in the hands of smaller companies, who can now compete with their newer, more niche products.

High inflation, high interest rates (Favour Value)
Larger companies that can absorb the higher cost of borrowing can continue to invest in the company through R&D and expansion.
High Inflation creates an environment for established companies with existing products in the market to reprice them and increase their earnings without affecting sales.
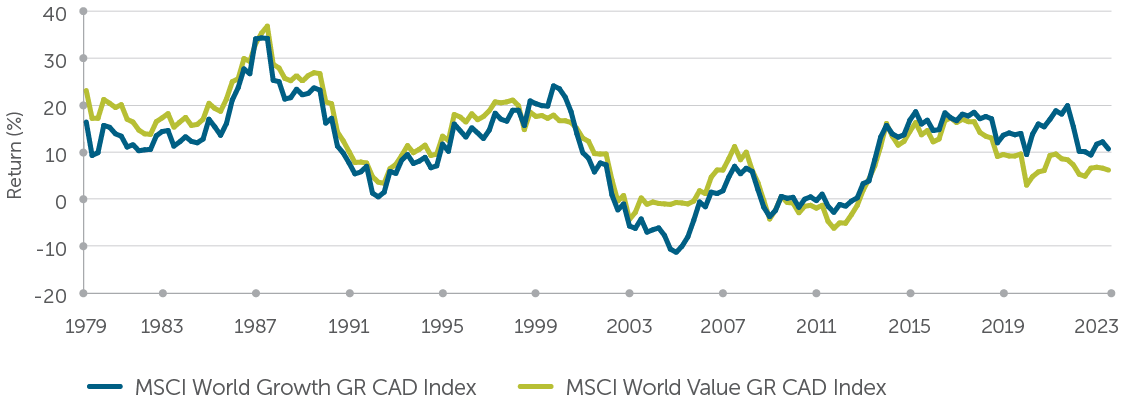
The chart below demonstrates how growth and value stocks have historically tended to perform over time.
Growth vs. Value
Historical 5-year rolling returns

Source: Morningstar Research Inc. as of September 30, 2023.

The importance of style diversification
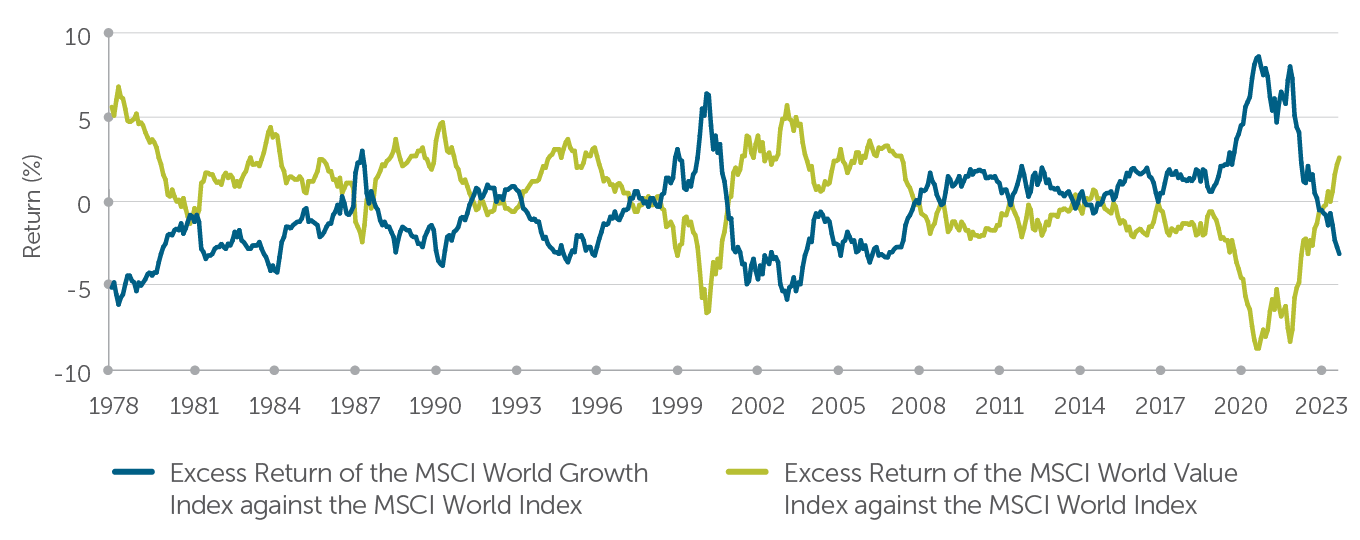
Neither growth nor value investment styles have consistently outperformed the other historically. Instead, there are periods where growth has been in favour while value has underperformed and vice versa.
The interrelationship between growth and value-oriented stocks
3-year rolling returns versus the MSCI World Index

Source: Morningstar Research Inc. as of September 30, 2023.
This underscores the importance of having style diversification in your portfolio.
![]()

© 2023 Morningstar Research Inc. All rights reserved. The information contained herein: (1) is proprietary to Morningstar and/or its content providers; (2) may not be copied or distributed; and (3) is not warranted to be accurate, complete, or timely. Neither Morningstar nor its content providers are responsible for any damages or losses arising from any use of this information. Past performance is no guarantee of future results.
Segregated Fund contracts are issued by The Empire Life Insurance Company (“Empire Life”). A description of the key features of the individual variable insurance contract is contained in the Information Folder for the product being considered. Any amount that is allocated to a segregated fund is invested at the risk of the contract owner and may increase or decrease in value. All returns are calculated after taking expenses, management and administration fees into account.
October 2023


