Bi-Monthly CAR Update: The MA Private Passenger Auto Insurance Marketplace
Agency Checklists first update of the year, with respect to the current state of the of the Private Passenger Automobile Insurance marketplace, takes a look at market share data as of November 2022, the latest date for which complete data is available.
As always, many thanks to the Commonwealth Automobile Reinsurers which acts as the statistical agent for motor vehicle insurance in the Commonwealth of Massachusetts and provides Agency Checklists with all the data presented here.
So, without further ado, a look at the latest data points:
Three take-aways from this update:
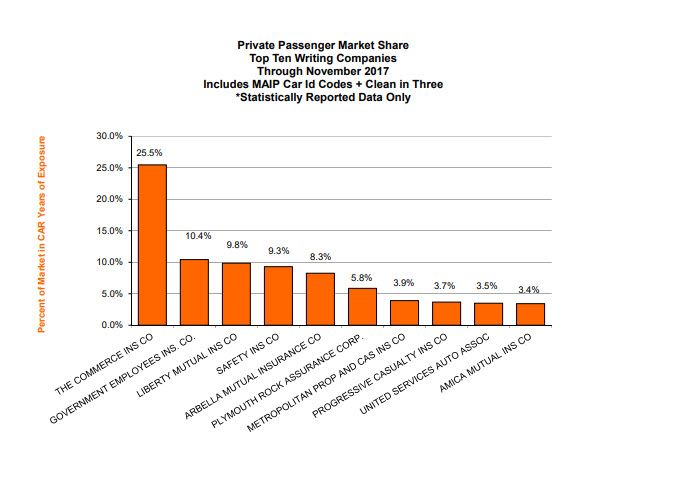
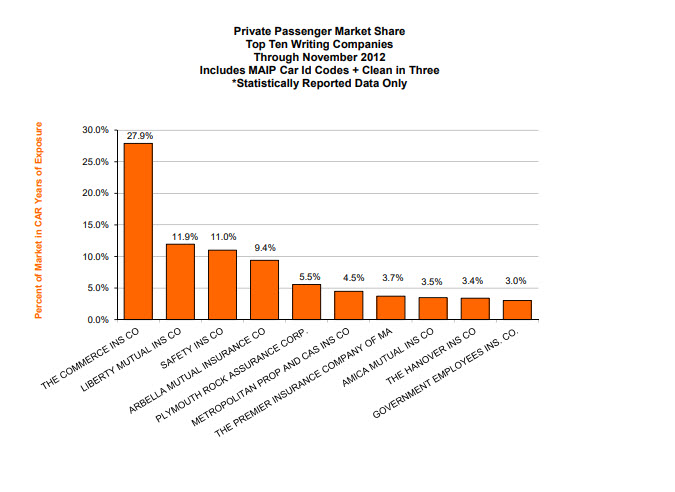
While it may appear that little changes in the Massachusetts private passenger auto insurance marketplace from month-to-month, a lot has changed over the past decade since Agency Checklists first began publishing its bi-monthly updates as can be seen in the snapshots provided below. For example:
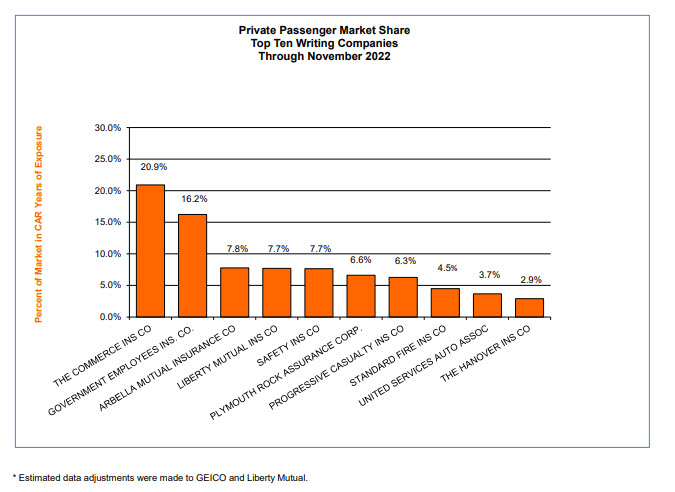
The top Private Passenger Auto Insurance in Massachusetts, MAPFRE (Commerce), which celebrated its 50th Anniversary in 2022, continues to be the number one Private Passenger Auto Insurance in Massachusetts with a 20.91% as of November 2022. Five years ago, however, the insurer had a market share of 25.5%, while 10 years ago in July 2012, it was 27.9%.
Over the past five years, GEICO has increased its market share percentage by almost 6% (5.8%), going from 10.4% in 2017 to its current 16.23%.
There are now three top five insurers who are neck-in-neck with a ~7% share of the marketplace: third-ranked Arbella with a 7.77% share, fourth-ranked Liberty Mutual with a 7.70% share, and fifth-ranked Plymouth Rock with a 7.65% share.
In total, the top 10 insurers continue to claim most of the marketplace with an 84.21% of the marketplace, while the top two insurers, MAPFRE and GEICO, dominate even further with a combined market share of 37.14%
The Private Passenger Auto Insurance Marketplace
Exposures & Market Share as of November 2022
CompanyExposuresMarket Share1. COMMERCE946,99120.91%2. GEICO735,06416.23%3. ARBELLA352,0067.77%4. LIBERTY MUTUAL348,6687.70%5. SAFETY346,5787.65%6. PLYMOUTH ROCK299,2666.61%7. PROGRESSIVE284,0256.27%8. STANDARD FIRE203,5584.50%9. U S A A165,6853.66%10. HANOVER131,6092.91%11. AMICA MUTUAL126,2932.79%12. METROPOLITAN117,9202.60%13. ALLSTATE92,8352.05%14. QUINCY MUTUAL74,6491.65%15. NORFOLK AND DEDHAM MUTUAL58,2661.29%16. AMERICAN FAMILY57,7491.28%17. VERMONT MUTUAL47,9661.06%18. FOREMOST21,0110.46%19. STATE FARM20,0010.44%20. PREFERRED MUTUAL15,9890.35%21. GREEN MOUNTAIN15,3870.34%22. BANKERS STANDARD12,4020.27%23. PURE11,4760.25%24. TRUMBULL10,2630.23%25. ELECTRIC8,8080.19%26. FARM FAMILY7,3910.16%27. CINCINNATI6,0850.13%28. MARKEL AMERICAN3,5830.08%29. AMERICAN INTERNATIONAL2,3580.05%30. MIDDLESEX1,1870.03%31. TOKIO1,0620.02%32. HARLEYSVILLE WORCESTER8710.02%33. FIREMEN’S INS CO6750.01%34. AMERICAN FAMILY HOME1190.00%35. AMERICAN BANKERS1110.00%TOTALS4,527,906100.00%Estimated data adjustments were made to GEICO and Liberty Mutual.
A 10-Year Retrospective of the Marketplace
The following are graphs depict the state of the Private Passenger Auto Insurance Marketplace over the past 10 years. The first graph shows the top 10 auto insurers as of November 2022, followed the top 10 insures five years earlier in November 2017, followed by the top 10 from a decade ago in November 2012. Below these, there are now added side by side comparisons (viewd by sliding the arrows over the graphs) which allows for further comparisons. Unlike updates in previous years, all of the past years included in this review have now been after the advent of “Managed Competition”.
November 2022
November 2017
November 2012
Side-by-Side Comparisons
November 2022/November 2017 Comparison
Use the arrows to slide over each graph to view each graph individually or for further comparison.


November 2022/November 2012 Comparison
Use the arrows to slide over each graph to view each graph individually or for further comparison.


How to view all of the 2022 updates on the Private Passenger Auto Insurance Marketplace in Massachusetts


