Bi-Monthly CAR Update: The MA Commercial Auto Insurance Marketplace

Agency Checklists’ first update of the year, with respect to the current state of the Commercial Auto Insurance marketplace in Massachusetts, reviews the data for this lines of insurance as of November 2022, the latest date for which complete data is currently avaialble.
Every two months, Agency Checklists reports on the latest data to give a snapshot of the current state of the Commercial Automobile insurance marketplace in Massachusetts in order for our readers to get a better sense of the trends and movements happening within this line of insurance.
As always, all of the data presented here is provided courtesy of the Commonwealth Automobile Reinsurers. For those unfamiliar with the Commonwealth Automobile Reinsurers, “CAR” is the official statistical agent for motor vehicle insurance in the Commonwealth of Massachusetts.
So, without further ado, a look at the latest data points:
Four thoughts from this month’s update:
Commerce and Safety continue to occupy the largest market shares of the Commercial Auto Insurance marketplace with a 13.84% and 12.64% respectively. Combined, they claim a just over a quarter share of the entire market with a combined 26.48% market share.
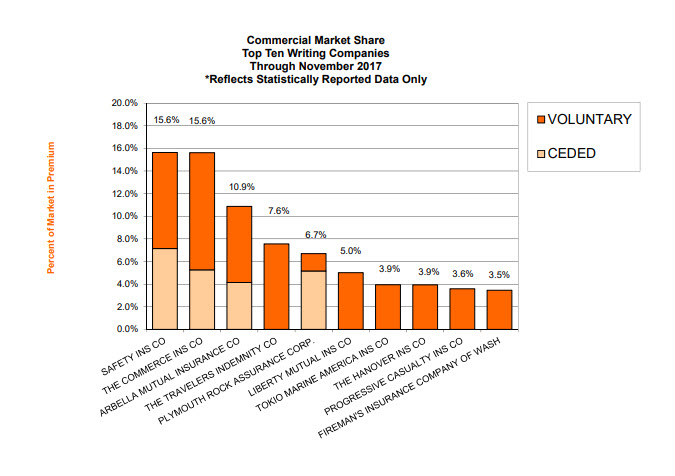
Five years ago, these same two insurers each claimed a 15.6% share of the marketplace at this same time.
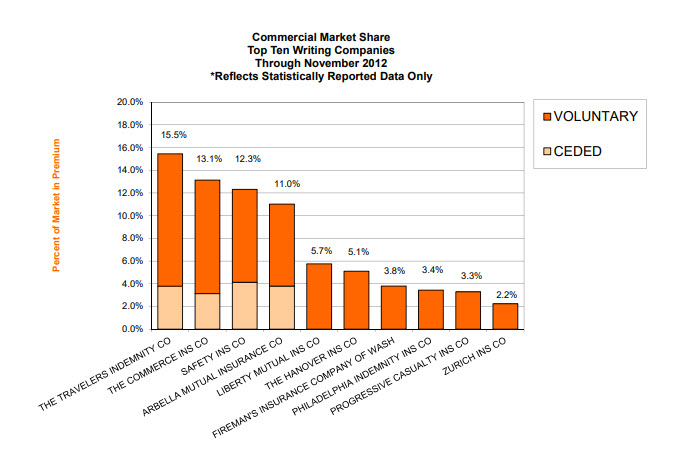
Ten years ago, however, it was Travelers who commanded the largest share in this marketplace with a 15.5% market share in November 2012. As fo November 2017, it is now the fifth-largest Commercial Auto Insurer in Massachusetts with a 7.35% market share as of November 2022.
In comparison, third-ranked Arbella has more or less maintained its market share over the past ten years as the third-largest Commercial Auto writer in the Commonwealth.
The Commercial Auto Marketplace in Massachusetts
Exposures & Market Share as of November 2022
CompanyPremiumsMarket Share1. COMMERCE136,459,07713.84%2. SAFETY124,563,47112.64%3. ARBELLA104,856,37710.64%4. PROGRESSIVE87,153,0528.84%5. TRAVELERS72,427,7777.35%6. PLYMOUTH ROCK47,937,5034.86%7. TOKIO MARINE & NACHIDO37,090,3923.76%8. FIREMAN’S36,233,0723.68%9. LIBERTY MUTUAL INS32,180,8133.26%10. HANOVER28,539,7112.90%11. ZURICH27,696,3352.81%12. SELECTIVE INSURANCE24,094,1482.44%13. UTICA19,273,1561.96%14. TWIN CITY FIRE INS15,465,7901.57%15. OLD REPUBLIC14,102,9941.43%16. NATIONAL GRANGE13,903,7071.41%17. GREAT AMERICAN13,209,5561.34%18. NEW HAMPSHIRE10,580,0541.07%19. FEDERATED MUTUAL10,349,1511.05%20. GREEN MOUNTAIN9,970,3331.01%21. EMPLOYERS MUTUAL9,912,2211.01%22. FEDERAL9,847,3931.00%23. AMERICAN CASUALTY9,117,6920.93%24. FARM FAMILY7,913,3530.80%25. N&D MUTUAL7,894,8330.80%26. CENTRAL MUTUAL INS7,307,9930.74%27. BANKERS5,991,6530.61%28. US FIRE5,767,9200.59%29. MIDDLESEX INS CO5,002,6670.51%30. MERCH MUTUAL4,786,9260.49%31. HARLEYSVILLE INS3,888,3970.39%32. CINCINNATI3,877,4400.39%33. QUINCY MUTUAL3,456,0020.35%34. IMPERIUM3,207,0490.33%35. ARCH3,146,3090.32%36. PENN LUMBERMENS2,587,4030.26%37. NEW YORK AND GENERAL INS2,444,2010.25%38. STARR INDEMNITY2,391,5070.24%39. PREFERRED MUTUAL2,377,1290.24%40. MOTORISTS2,058,5500.21%41. LANCER INSURANCE CO.1,751,3680.18%42. STATE AUTO1,723,4200.17%43. EVEREST NATIONAL1,349,7360.14%44. ATLANTIC SPECIALTY1,249,2690.13%45. ALLSTATE1,139,0320.12%46. GREENWICH948,0990.10%47. SECURITY NATIONAL858,1630.09%48. PENN MNFCT ASSC INS780,5080.08%49. CHURCH MUTUAL764,5420.08%50. PROTECTIVE668,2040.07%51. ARGONAUT651,2440.07%52. BERKSHIRE HATHAWAY563,0230.06%53. SOMPO AMERICA561,8520.06%54. PRIME PROPERTY & CASUALTY533,2560.05%55. ALLIED WORLD SPECIALTY464,3960.05%56. GEICO432,3290.04%57. AMERICAN AUTOMOBILE356,3120.04%58. AXIS REINSURANCE311,0380.03%59. QBE288,8530.03%60. MITSUI SUMITOMO245,0160.02%61. AMICA MUTUAL184,9460.02%62. RLI180,8190.02%63. STARSTONE NATIONAL159,2880.02%64. FALLS LAKE105,4350.01%65. STATE FARM79,0030.01%66. GUIDEONE MUTUAL50,5030.01%67. MARKEL AMERICAN41,8470.00%68. CUMIS38,6350.00%69. T.H.E. INS CO31,7760.00%70. HDI GLOBAL26,3830.00%71. AMERICAN HALLMARK17,7420.00%72. AMERICAN BANKERS INS CO15,1670.00%73. AMERICAN ALTERNATIVE8480.00%74. AMERICAN FAMILY7620.00%TOTALS985,635,921100.00%
Looking Back: A Retrospective on the Top 10 Commercial Auto Insurers Over the Past 10 Years
The following are graphs depicting the state of the Commercial Auto Insurance Marketplace over the past 10 years. The first graph shows the top 10 Commercial Auto Insurers as of November 2022, followed by the top 10 insurers five years earlier in November 2017, and then the top 10 from a decade ago in November 2012. Below these three graphs, there is now an additional side-by-side comparisons (viewed by sliding the arrows over the graphs) which allows for further comparisons.
November 2022

November 2017

November 2012

Side-by-Side Comparisons
November 2022/November 2017 Comparison
Use the arrows to slide over each graph to view each graph individually or for further comparison.

November 2022/November 2012 Comparison
Use the arrows to slide over each graph to view each graph individually or for further comparison.
Past Market Share Reports
For those interested in reviewing all of our bi-monthly updates throughout 2022 in order to get a sense of how the Commercial Auto Insurance marketplace continues to evolve, please find links to Agency Checklists’ previous updates below:
2022 Market Share Reports