Evaluating Whole Life Insurance Policies

Podcast: Play in new window | Download
When purchasing whole life insurance, the buyer makes a long-term commitment to a strategy and–to a slightly lesser degree–an insurance company. This notion appears very simple on its face. It makes sense and we can follow the logic pretty easily, or at least assume we can.
But a lot of people struggle with the inter-temporal nature of such a decision–and no whole life insurance isn’t alone in the case of this phenomenon. It’s easy to lose sight of the end goal when things are going on in our immediate face that cause us to be distracted. This, I contend is one of the leading sources of misguided views and advice when it comes to whole life policies both currently recommended and bought at some point in the past. Let me explain…
How am I Doing? Where are you going?
We frequently field questions from potential and post whole life insurance policy buyers who want to know if their policy is good. Should they buy? Should they stay the course? The number one problem with the way many of them look at the situation is that they attempt to qualify the worthiness of their whole life policy against the here and now of what they think are the alternatives and their present accomplishments.
For example, let’s say Ralph is considering a whole life insurance purchase. He presents us with the ledger from the proposed policy, and it looks as such:
Some key metrics we note are that by year 10, the policy achieves a negative return. This return is -3.67% to be exact. We see the policy will break even at year 14 assuming dividends remain at their current level until that time. We also see that by year 20, the policy will achieve a 2.36% rate of return.
Is this a good policy? It’s easy to say no in my eyes. Though, I must admit there are a number of objectives Ralph might have that might dissuade me from my original position. Let’s assume Ralph seeks cash value optimization but also has a keen eye on building potential legacy value for his kids and/or grandkids. Armed with that information, I now more strongly say no, but not for the reasons Ralph might have initially suspected.
Lots of time, people get hung up on things like The negative return at year 1. In fact, few–far too few–are more outraged by the negative return come year 10. That, I contend, is more where the worry should originate.
Why?
Because 99.9% of all life policies issued today have a negative return in year 1 and the percentage that still has a negative return come year 2 is close to the same number. This isn’t unordinary and it’s no cause for concern. Looking at this figure datapoint isn’t useful.
But I can assure you that it is very possible to achieve a positive rate of return by year 10 with 100% of whole life policies designed and implemented to grow cash value in the policy as quickly as possible and achieve the greatest rate of return expressed as cash value relative to premiums paid.
So if I see a negative return still at year 10–and in this case, the rate of return is pretty deeply negative still–I know we have a problem.
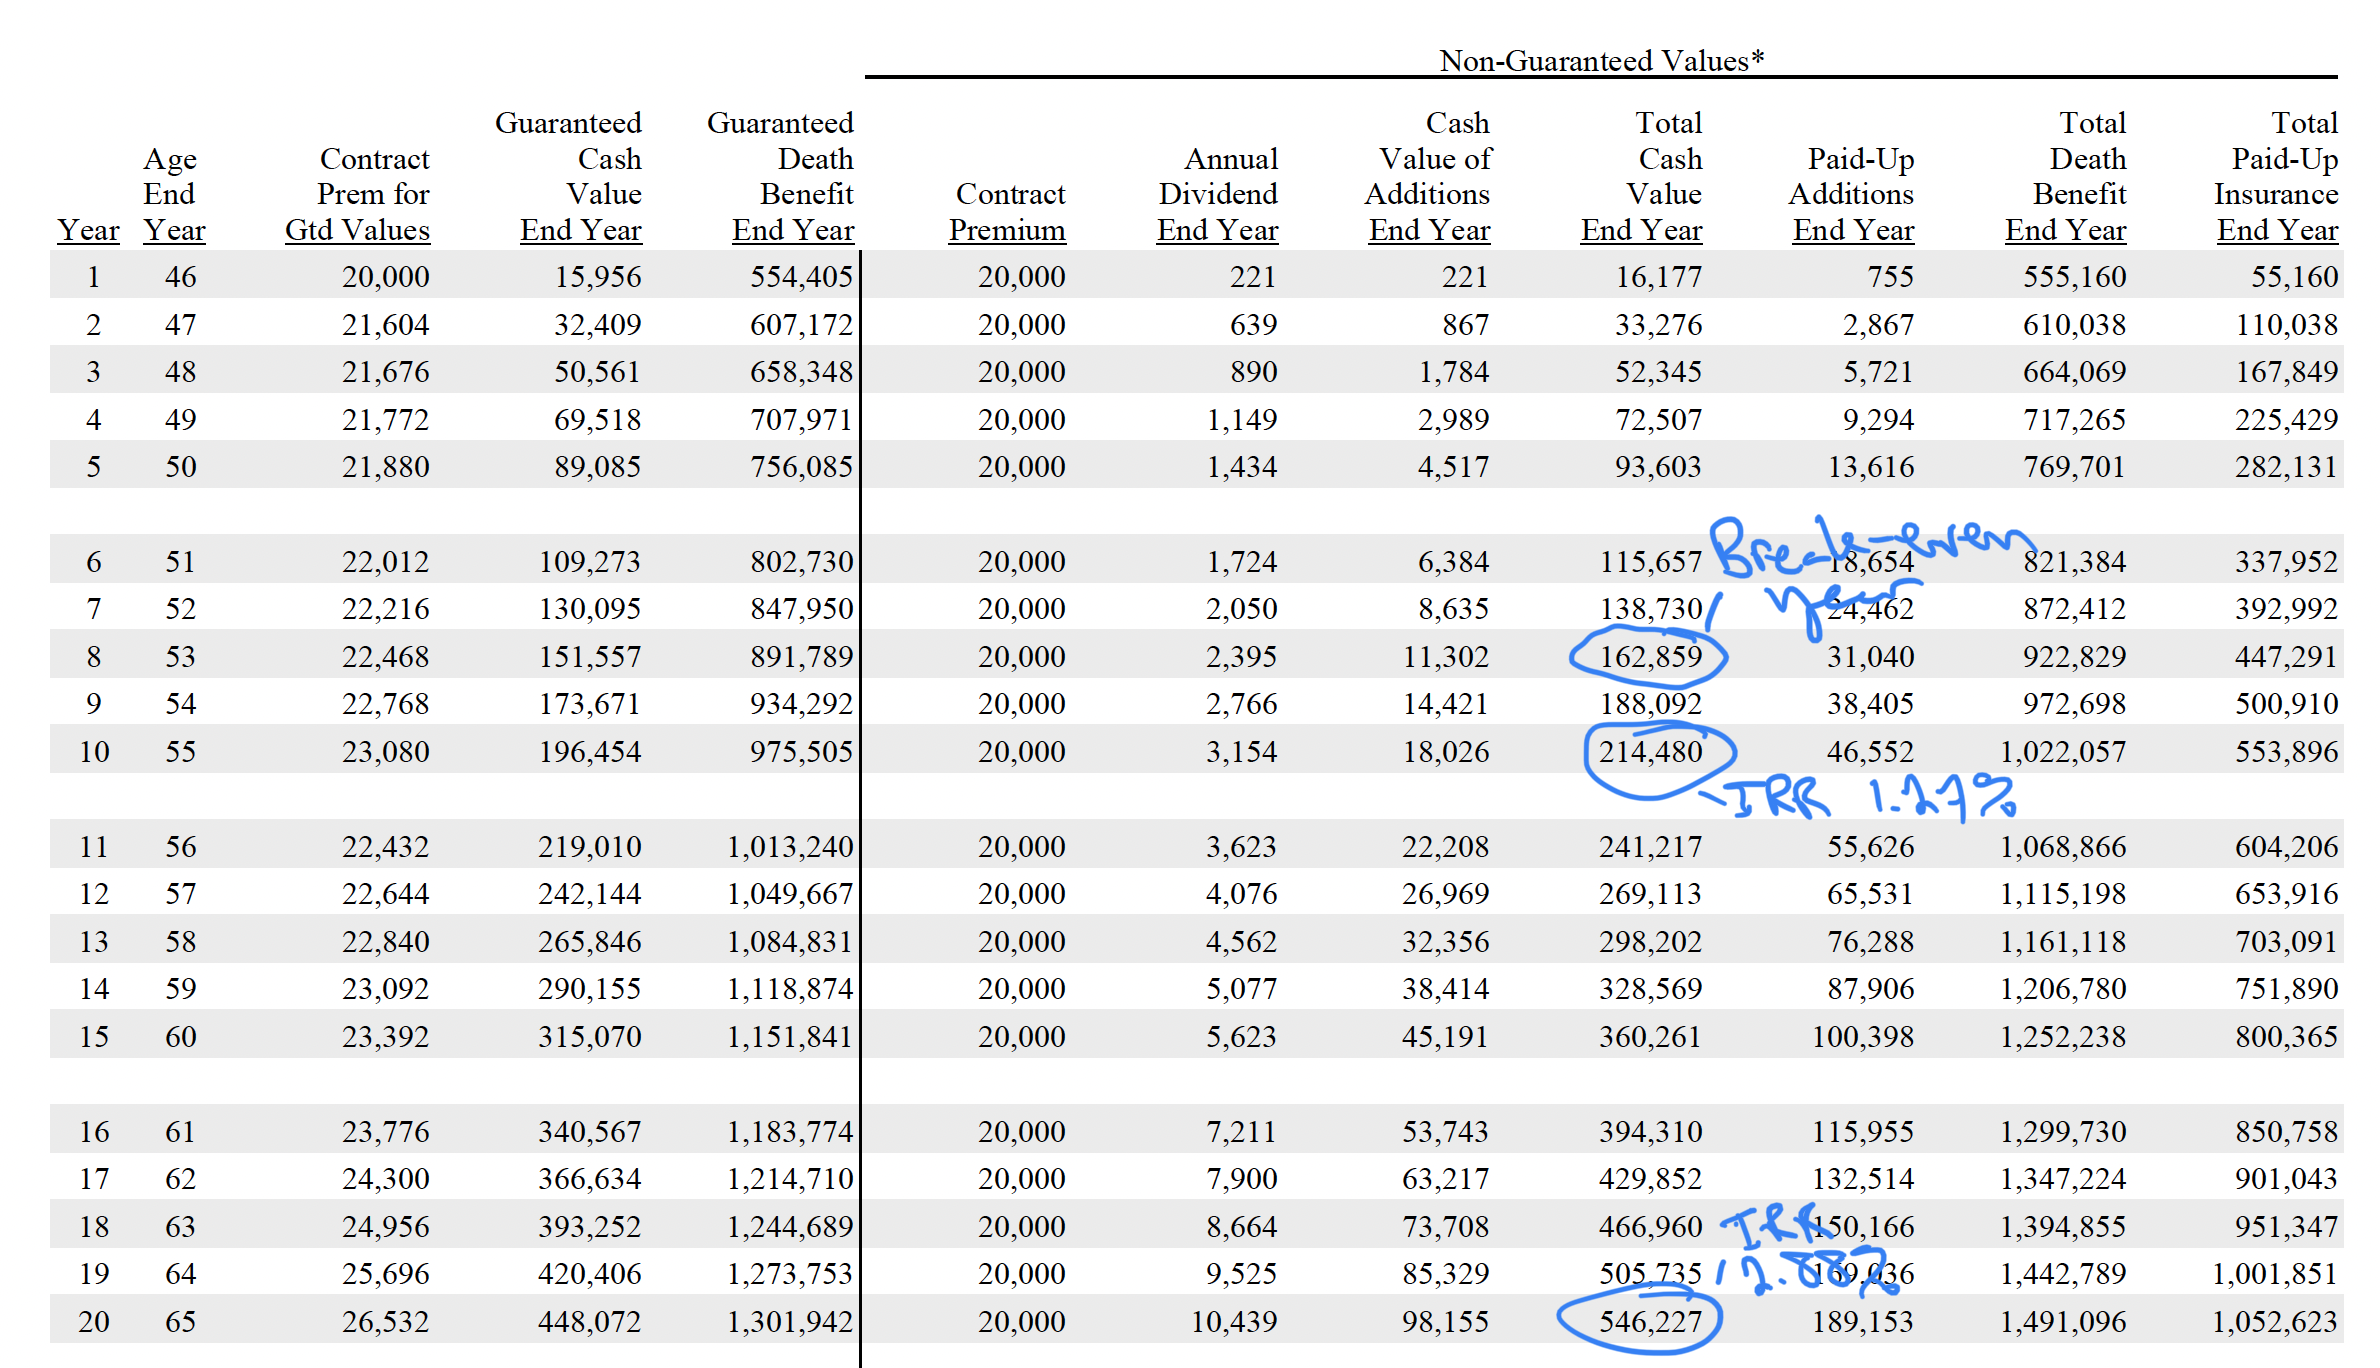
Consider this alternative:

With this policy design, we have a break-even at year 8, or six years sooner. Our rate of return come year 10 is 1.27%. Also, our rate of return at year 20 is 2.88%–higher than in the prior example. Lastly, notice that our year 20 death benefit is also higher in this example. We have more cash value and more death benefit.
But A Lot of People Fail to Look this Far Ahead
When we look further into the future, we see if the reasons for owning whole life insurance will come to fruition. This is what separates a good policy from a bad one. While I do understand that the $16,177 of additional cash value in the second example in year 1 is also a compelling reason to choose it over the first example, we might also fail to optimize our potential if we focus so myopically.
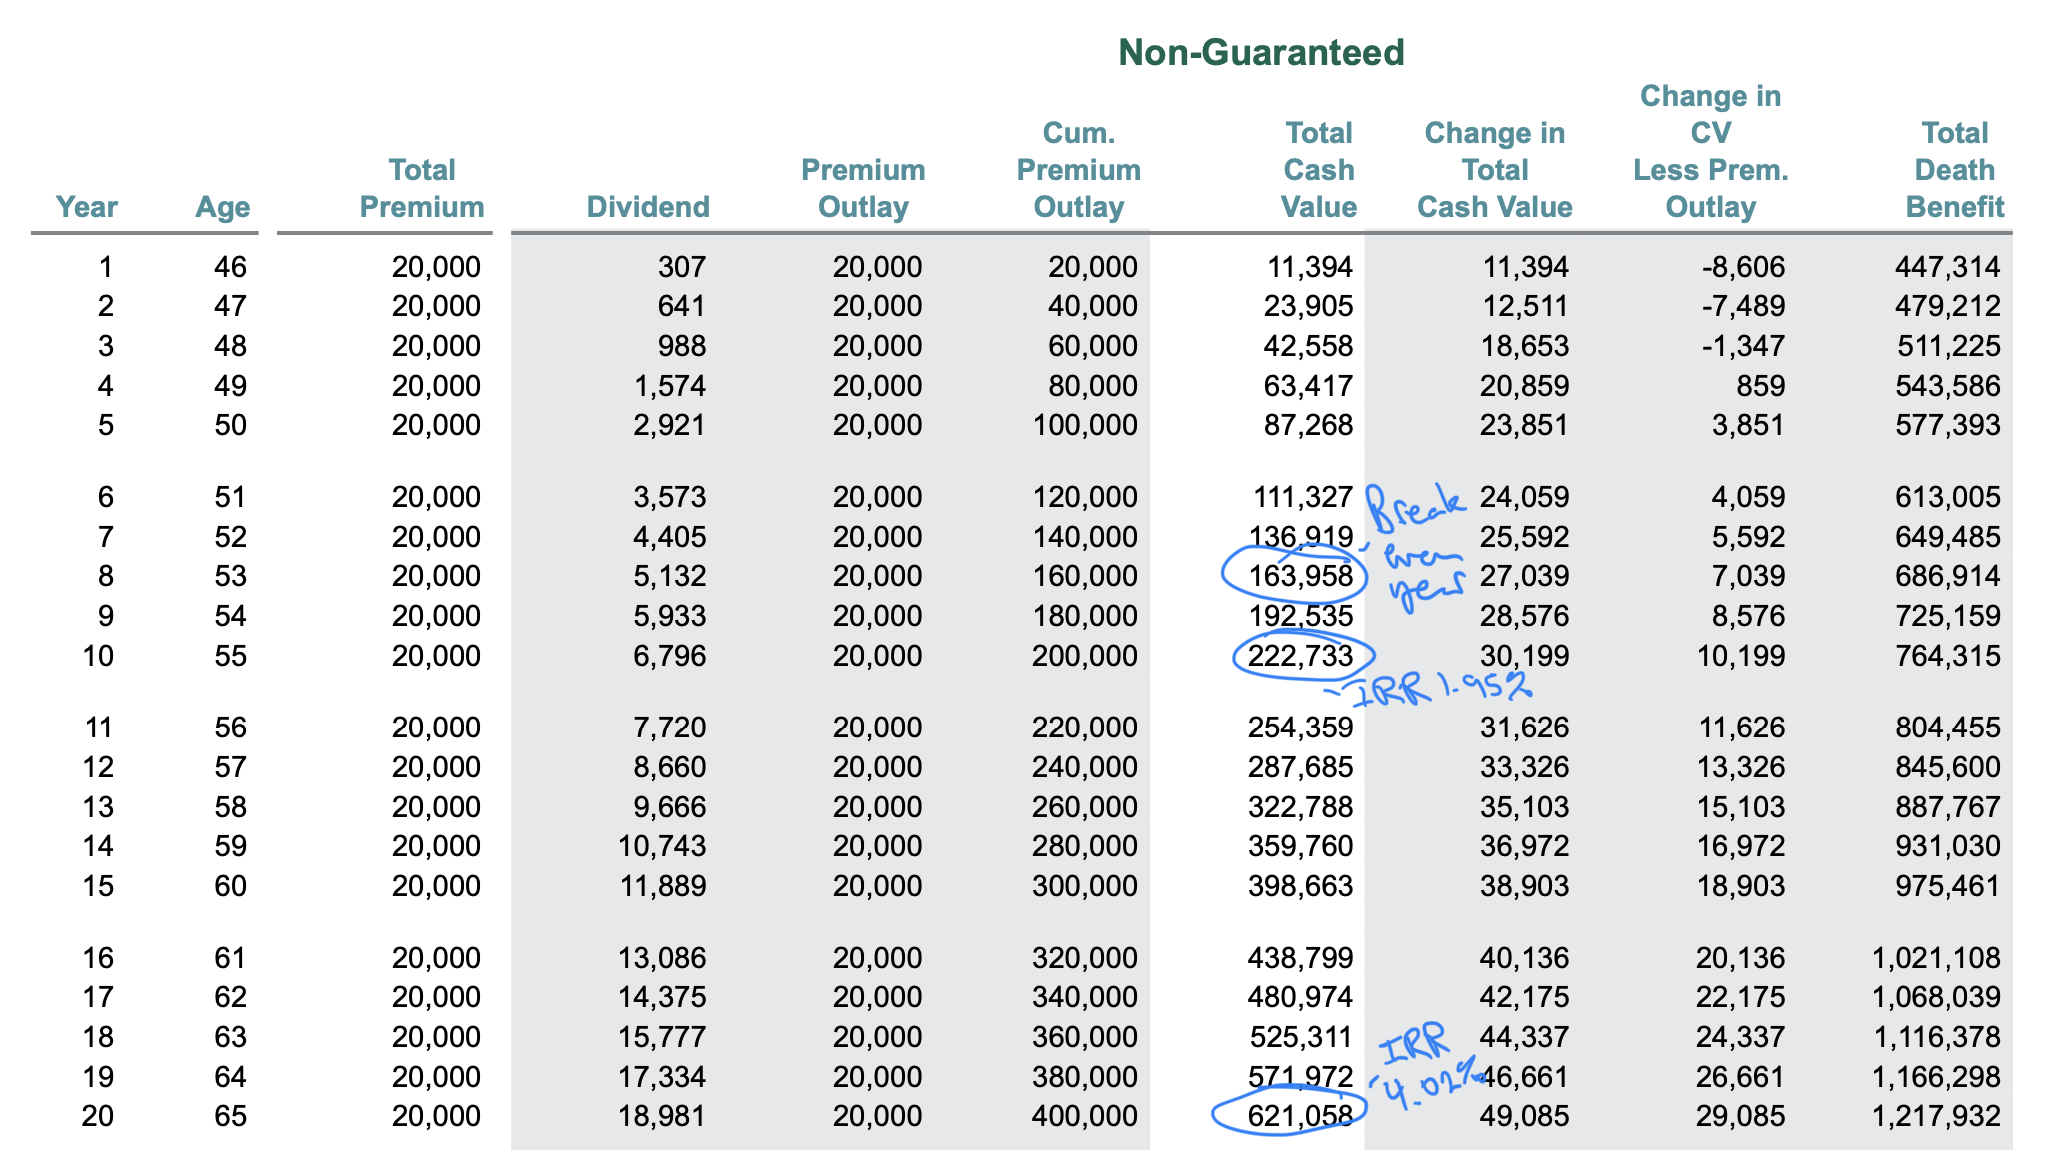
Consider this new example:

In this example, we have more than $0 in cash value in year 1, but we are behind the prior example. Our break-even year is the same. Year 10 rate of return is 1.95%, which is ahead of the better policy from before. But take a look at year 20. Rate of return at year 20 is 4.02%, which is considerably better than the prior example.
If we had evaluated this policy by its ability to produce cash value in year one against the other whole life policy that incorporated a better cash-building design, we’d likely pass on this policy. And doing that could cost us almost $75,000 come year 20.
Similar Problem When Looking at In-Force Policies
We receive a lot of inquiries from people who have already bought a whole life insurance policy and want to know if it’s “any good.” The majority of these inquiries often originate when someone looks at their rate of return achieved to date and begin comparing it to what they think they could have achieved if they had invested the money in the Stock Market. They rarely have a specific investment in mind. The more think of the various returns mentioned when they read financial articles and begin to assume that’s just what they would have achieved.
With whole life insurance, the critical evaluation is the trend of the growth in cash value–not necessarily the overall rate of return achieved to date. This is especially the case when we are within the first 10 policies years.
Say for example someone purchased a policy three years ago. The policy should still have a negative rate of return. The important review to determine if the policy is good or bad would be “is the policy on track to produce a strong rate of return later?” It’s difficult to impart the knowledge one would need to make that evaluation as a layperson. Spotting a good or bad trend comes with experience, but you could use the ledgers above to give yourself a relative idea of what is acceptable for a trend and what is not.


