4th Look 2023: Update of the MA Private Passenger Auto Insurance Marketplace
Latest Data as of July 2023
The State of the Private Passenger Marketplace
Published every other month, our regular CAR Update reviews the latest data on the current state of the of the Private Passenger Automobile Insurance marketplace. For this “fourth look” of the year, Agency Checklists is publishing the latest market share data as of July 2023, that last date for which complete data is available.
As always, many thanks to the Commonwealth Automobile Reinsurers which acts as the statistical agent for motor vehicle insurance in the Commonwealth of Massachusetts and provides Agency Checklists with all the data presented here.
So, without further ado, a look at the latest data points:
Exposures & Market Share as of July 2023
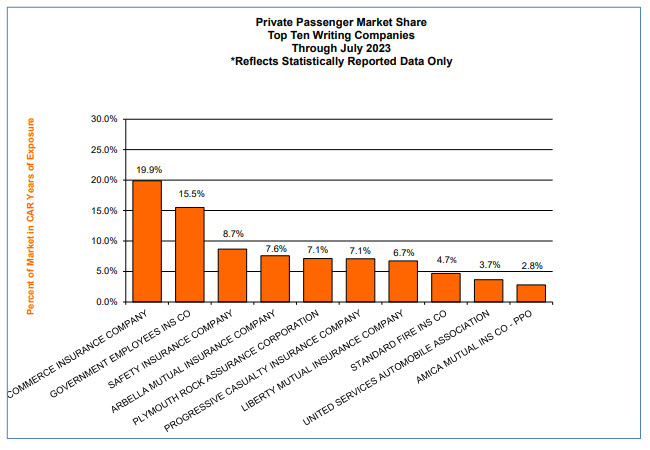
CompanyExposuresMarket Share1. COMMERCE588,00519.89%2. GEICO458,66315.51%3. SAFETY256,1518.66%4. ARBELLA224,1767.58%5. PLYMOUTH ROCK210,5777.12%6. PROGRESSIVE209,5707.09%7. LIBERTY MUTUAL198,8696.73%8. STANDARD FIRE138,1934.67%9. U S A A107,9783.65%10. AMICA MUTUAL82,4192.79%11. HANOVER79,7622.70%12. METROPOLITAN76,5452.59%13. ALLSTATE57,0661.93%14. QUINCY MUTUAL52,8251.79%15. NORFOLK AND DEDHAM MUTUAL45,6911.55%16. AMERICAN FAMILY43,7711.48%17. VERMONT MUTUAL32,9331.11%18. STATE FARM12,7890.43%19. PREFERRED MUTUAL12,0450.41%20. GREEN MOUNTAIN11,2660.38%21. FOREMOST10,0270.34%22. PURE8,3920.28%23. BANKERS STANDARD8,0650.27%24. TRUMBULL6,8250.23%25. ELECTRIC5,8580.20%26. CINCINNATI5,3060.18%27. FARM FAMILY5,2120.18%28. MARKEL AMERICAN3,0740.10%29. AMERICAN INTERNATIONAL1,3610.05%30. MIDDLESEX9680.03%31. HARLEYSVILLE WORCESTER8900.03%32. TOKIO7390.03%33. FIREMEN’S INS CO6240.02%TOTAL2,956,735100.00%
Agency Checklists’ Proprietary Retrospective of the PPA Marketplace
The following side-by-side comparisons allow our readers to review the state of the Private Passenger Auto Insurance Marketplace from various aspects over the past 10 years.
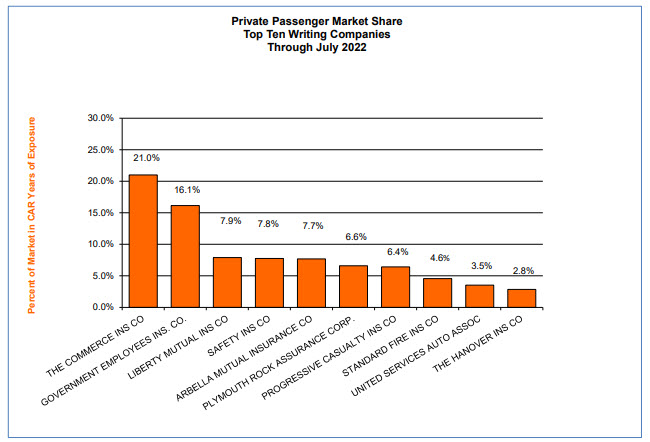
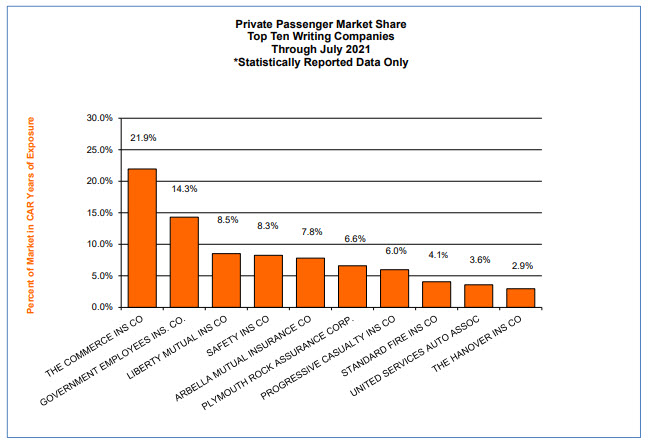
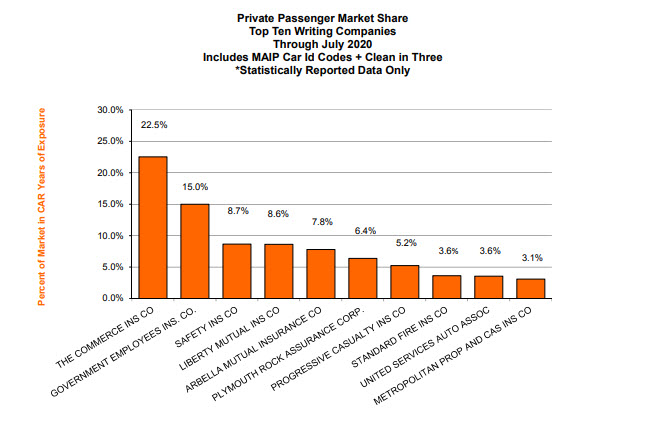
The first four side-by-side comparisons shows the July 2023 marketplace versus the same marketplace in July 2022, July 2021, July 2020, and July 2019. Following these graphs, are two additional comparisons between the top 10 insurers in July 2023 versus the top 10 insurers five years earlier in 2018, and then again from a decade ago in 2013.
Year-Over-Year Comparisons
Use the arrows to slide over each graph to view them individually or for further comparison.
July 2023 v. July 2022

July 2023 v. July 2021
July 2023 v. July 2020

July 2023 v. July 2019

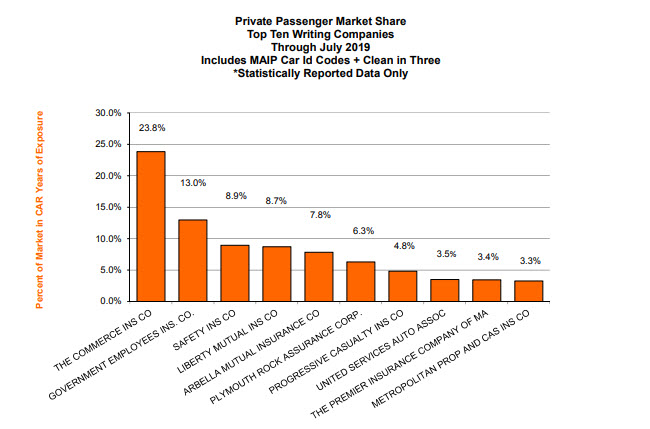
The Private Passenger Market Share 5 Years Ago
Use the arrows to slide over each graph to view each graph individually or for further comparison.
July 2023 v. July 2018

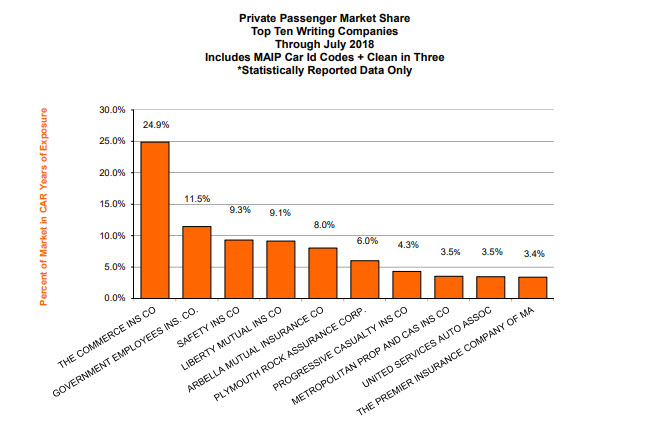
The Private Passenger Market Share 10 Years Ago
Use the arrows to slide over each graph to view each graph individually or for further comparison.
July 2023 v. July 2013

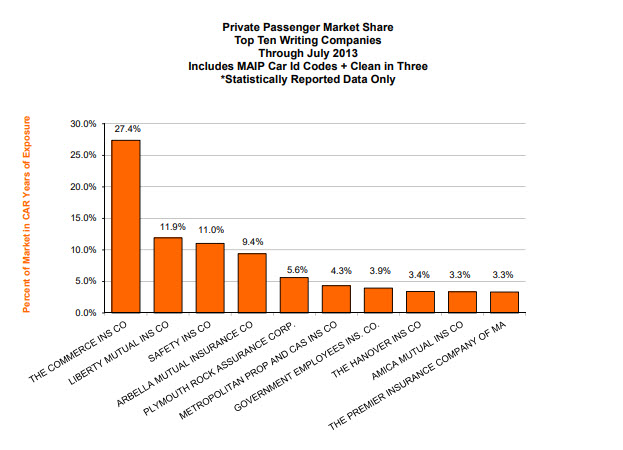
How to view all of the 2022 updates on the Private Passenger Auto Insurance Marketplace in Massachusetts
2023
2022


