1st Look 2024: The MA Commercial Auto Insurance Marketplace
State of the Marketplace as of February 2024

Every other month, Agency Checklists publishes a bi-monthly “check-up” on the current state of the Commercial Auto Insurance marketplace. The data reviewed for this line of insurance is provided courtesy of the Commonwealth Automobile Reinsurers.
For those readers unfamiliar with the Commonwealth Automobile Reinsurers, “CAR” is the official statistical agent for motor vehicle insurance in the Commonwealth of Massachusetts.
The ultimate aim of these “looks” is to get a better sense of the trends and movements happening within this line of insurance. For our current update, the data reflects the state of the market as of February 2024, the latest date for which complete CAR data is currently available.
Exposures & Market Share
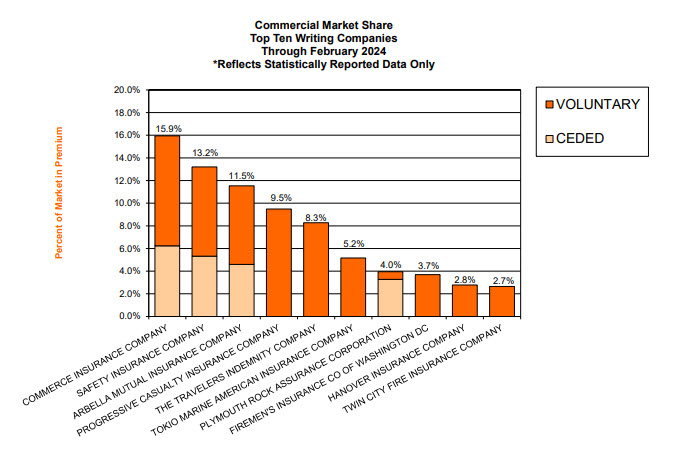
Company Name and RankPremiumsMarket Share1. COMMERCE32,768,45515.94%2. SAFETY27,140,47913.20%3. ARBELLA23,711,47111.54%4. PROGRESSIVE19,496,4159.49%5. TRAVELERS16,996,9088.27%6. TOKIO MARINE & NACHIDO10,616,9465.17%7. PLYMOUTH ROCK8,123,8693.95%8. FIREMAN’S7,600,1003.70%9. HANOVER5,715,7532.78%10. TWIN CITY FIRE INS5,448,9632.65%11. ZURICH5,446,3432.65%12. SELECTIVE INSURANCE5,328,0282.59%13. AMERICAN CASUALTY3,003,2801.46%14. UTICA2,983,7941.45%15. LIBERTY MUTUAL INS2,624,3761.28%16. NATIONAL GRANGE2,404,2701.17%17. FEDERAL2,294,1851.12%18. GREEN MOUNTAIN2,126,7841.03%19. FARM FAMILY2,117,9701.03%20. NEW YORK AND GENERAL INS1,935,0690.94%21. N&D MUTUAL1,902,3040.93%22. FEDERATED MUTUAL1,839,1100.89%23. CENTRAL MUTUAL INS1,795,0650.87%24. EMPLOYERS MUTUAL1,636,3510.80%25. MIDDLESEX INS CO1,274,4200.62%26. BANKERS1,266,1050.62%27. NEW HAMPSHIRE1,256,2910.61%28. MERCH MUTUAL1,151,2800.56%29. ARGONAUT880,6170.43%30. US FIRE843,2360.41%31. GREAT AMERICAN608,7660.30%32. GEICO588,4290.29%33. QUINCY MUTUAL561,2920.27%34. MOTORISTS555,1430.27%35. PREFERRED MUTUAL310,3680.15%36. ATLANTIC SPECIALTY265,1530.13%37. LANCER INSURANCE CO.258,9490.13%38. STATE AUTO187,8430.09%39. HARLEYSVILLE INS141,9010.07%40. SECURITY NATIONAL108,2390.05%41. PENN LUMBERMENS58,4810.03%42. PENN MNFCT ASSC INS55,2430.03%43. GREENWICH40,7540.02%44. AMERICAN AUTOMOBILE22,3360.01%45. PROTECTIVE16,2720.01%46. OLD REPUBLIC14,0200.01%47. QBE12,7780.01%48. STATE FARM8,6420.00%49. BERKSHIRE HATHAWAY6,7320.00%205,549,578100.00%
Agency Checklists’ Proprietary Retrospective of the Commercial Auto Marketplace
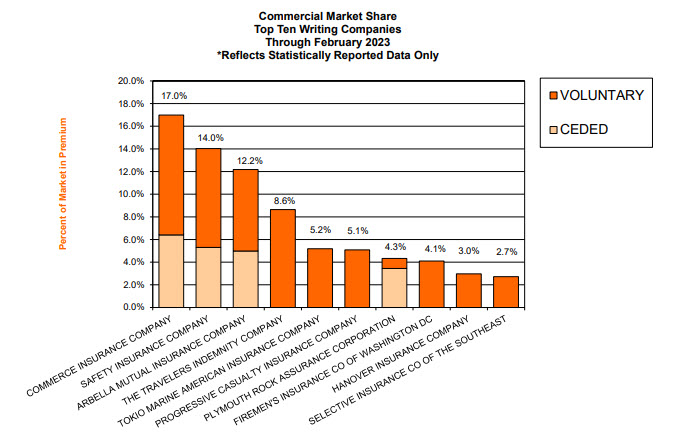
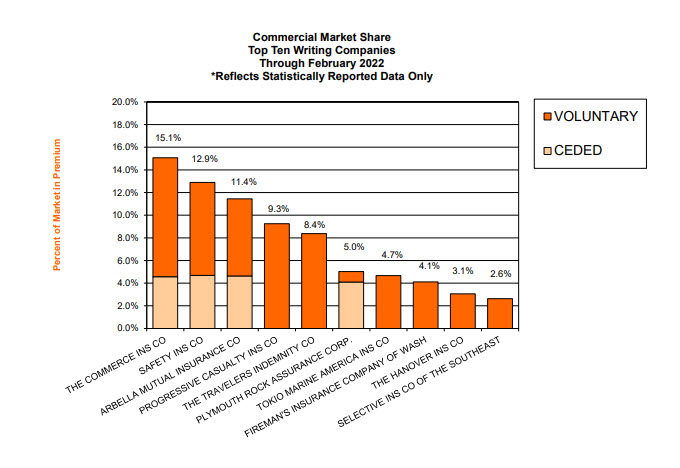
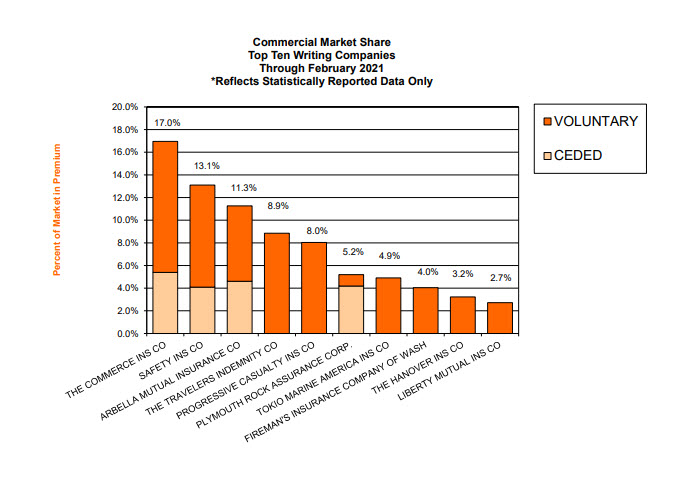
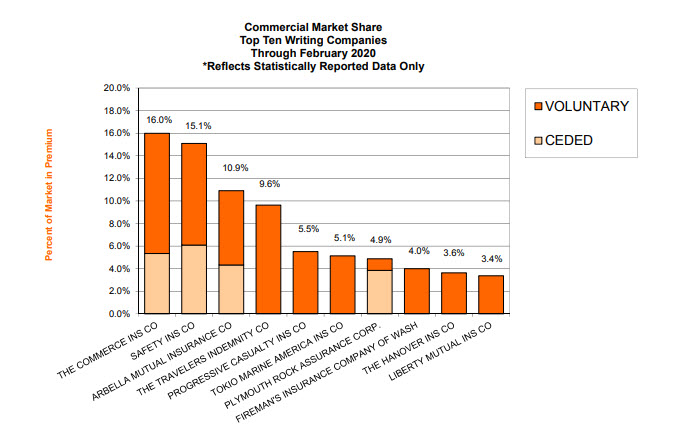
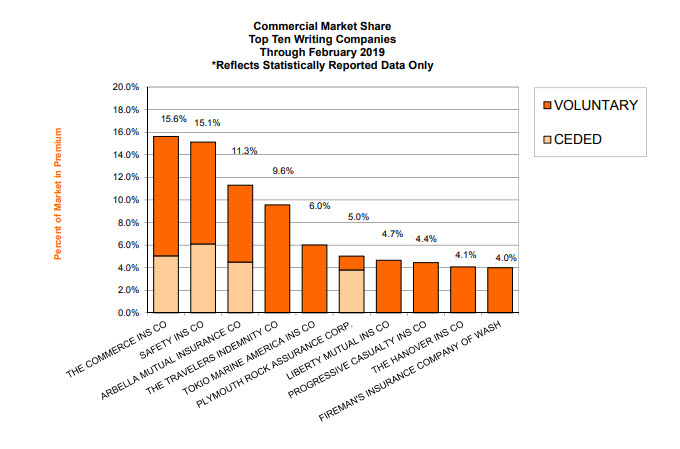
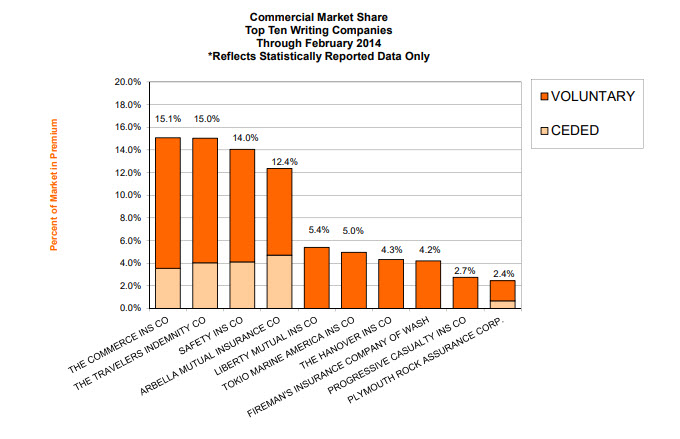
The following are graphs depicting the state of the Commercial Auto Insurance Marketplace over the past 10 years. The first graph shows the top 10 Commercial Auto Insurers as of February 2024, as compared to similar February 2023, February 2022, February 2021, and February 2020. Following these comparisons, there are two more comparisons with, one from five years ago in February 2019 and then the last from ten years ago in February 2014.
Each year can be compared by sliding the window to either the left or right on each of the graph comparisons below.
Use the arrows to slide over each graph to view them individually or for further comparison.
February 2024 v. February 2023
February 2024 v. February 2022

February 2024 v. February 2021
February 2024 v. February 2020
5-Year Comparison
Use the arrows to slide over each graph to view them individually or for further comparison.
February 2024 v. February 2020
10-Year Comparison
Use the arrows to slide over each graph to view them individually or for further comparison
Past Market Share Reports
For those interested in reviewing all of our bi-monthly updates throughout 2022 & 2023 in order to get a sense of how the Commercial Auto Insurance marketplace continues to evolve, please find links to Agency Checklists’ previous updates below:
2023 Market Share Reports
2022 Market Share Reports